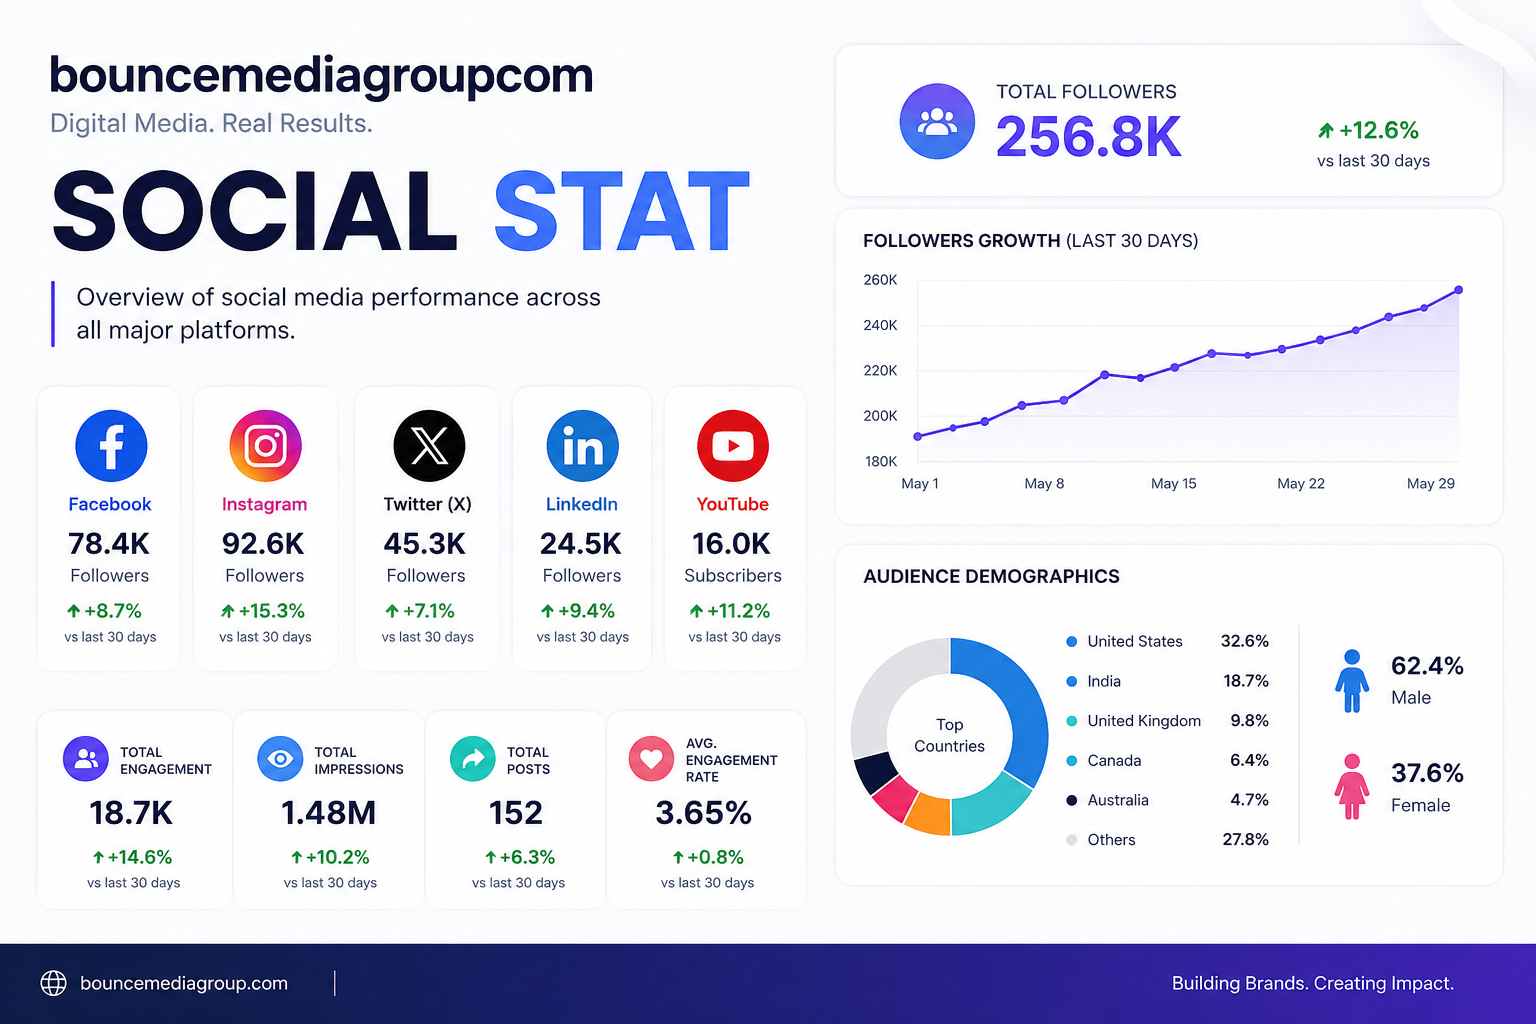
Search for bouncemediagroupcom social stat, and you will find surprisingly different explanations. Some articles describe it as a powerful social media analytics tool with real-time dashboards, competitor tracking, automated reports, and account integrations. Others treat it as a general phrase for BounceMediaGroup.com’s social performance.
The difference matters because publicly available evidence does not clearly confirm that BounceMediaGroup.com operates a subscription-based analytics platform.
The website does have a “Social Stats” category containing articles about social media, audience growth, Instagram activity, TikTok strategy, and the website’s claimed performance. However, that is not the same as a documented software product with a login page, pricing plans, API documentation, or verified integrations.
This guide explains what the term probably means, what public information is available, which claims require caution, and how to evaluate social media statistics properly.
What Does Bouncemediagroupcom Social Stat Mean?
The phrase bouncemediagroupcom social stat most likely refers to social media statistics connected with BounceMediaGroup.com, including:
- Follower numbers
- Audience growth
- Reach and impressions
- Likes, comments, shares, and saves
- Referral traffic from social networks
- Click-through rates
- Content performance
- Campaign conversions
It may also refer to the “Social Stats” content section on BounceMediaGroup.com. That category publishes general articles about social media trends and performance measurement rather than presenting an obvious public analytics dashboard.
One competitor article reaches a similar conclusion, stating that Social Stat appears to be an editorial category rather than a tool readers can subscribe to.
Is It a Real Social Media Analytics Tool?
There is not enough public evidence to confidently describe it as a standalone analytics platform.
Several ranking pages claim that users can create accounts, connect Facebook, Instagram, LinkedIn, TikTok, X, and YouTube, configure alerts, export reports, access APIs, and compare competitors. However, those pages do not provide screenshots of the software, official documentation, a pricing page, a verified login area, or direct evidence of platform integrations.
The official website instead displays:
- A Social Stats article category
- General marketing and technology content
- Articles discussing social media performance
- Publisher-reported statistics about its own reach
That suggests the safest interpretation is that the term describes a topic, report, or content category unless BounceMediaGroup.com publishes clearer product documentation.
Why Other Articles May Be Confusing
Many competing articles repeat similar descriptions. They call the service a unified dashboard, real-time monitoring system, competitor analysis tool, or automated reporting platform.
Repeating a claim across multiple websites does not prove it is accurate. Reliable product coverage should ideally include:
- A link to the official product page
- Original screenshots
- Pricing or account information
- Supported-platform documentation
- Data-collection methodology
- A publication or measurement date
- Clear disclosure of limitations
Without those details, readers should treat feature descriptions as unverified claims rather than established facts.
What Public Social Statistics Are Available?
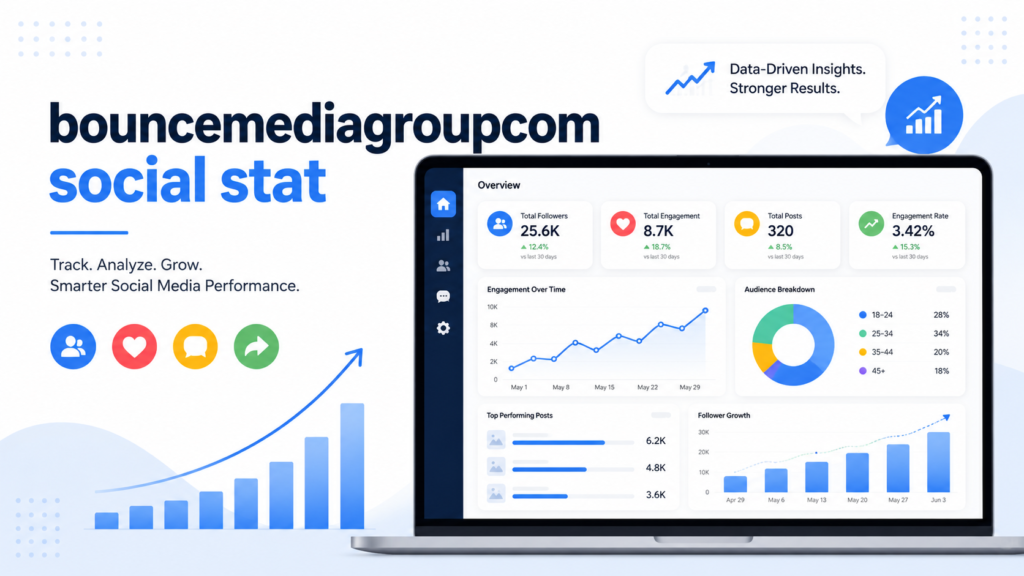
BounceMediaGroup.com published two social-statistics articles on June 19, 2026. One article reported specific numbers, while the other gave broader platform and demographic statements.
Here is a summary of the claims:
| Reported metric | Publisher’s claim | Verification status |
|---|---|---|
| Combined social audience | Nearly 240,000 followers | No supporting profile totals shown |
| Year-over-year follower growth | 18% | Measurement period not documented |
| Average engagement rate | 2.1% | Formula and source data not shown |
| Increase in social referrals | 12% | Analytics report not provided |
| Return on ad spend | 1.6x | Spend and revenue figures not disclosed |
| Instagram Reels reach | 52% higher than static posts | Sample size not provided |
| LinkedIn lead conversion rate | 2.4% | Tracking method not explained |
| Main audience age | 25–44 | Demographic export not provided |
These figures appeared on the publisher’s own website, but the articles did not show raw data, screenshots, linked social profiles, analytics exports, sample sizes, campaign dates, or a detailed methodology. They should therefore be described as publisher-reported figures, not independently audited statistics.
This does not automatically mean the numbers are incorrect. It means there is not enough supporting evidence for an outside reader to reproduce or verify them.
The Most Important Social Media Metrics
Whether you are examining Bounce Media Group or your own brand, follower count alone cannot explain social media success.
1. Follower Growth Rate
Follower growth rate shows how quickly an account’s audience is changing.
A simple formula is:
Follower growth rate = New followers ÷ Starting followers × 100
For example, an account that starts with 10,000 followers and gains 500 has a 5% growth rate for that period.
Always record the starting date, ending date, gained followers, and lost followers. A percentage without a time period has little meaning.
2. Engagement Rate
Engagement rate measures how actively people respond to content.
Interactions may include:
- Likes
- Comments
- Shares
- Saves
- Reactions
- Link clicks
Common formulas divide interactions by reach, impressions, or follower count. Because these formulas produce different results, a report should clearly state which calculation it uses.
3. Reach and Impressions
Reach normally represents the number of unique accounts that saw content. Impressions count total displays, including repeat views by the same person.
If a post reaches 5,000 people and generates 8,000 impressions, some users probably saw it more than once.
Neither metric automatically proves that people paid attention or took action.
4. Click-Through Rate
Click-through rate, or CTR, measures how often viewers click a link.
CTR = Link clicks ÷ Impressions × 100
CTR is especially useful for posts designed to generate website visits, registrations, downloads, or product-page views.
5. Social Referral Traffic
Social referral traffic measures visits arriving at a website from social platforms.
A useful report should separate:
- Organic social visits
- Paid social visits
- Individual platforms
- Campaigns
- Landing pages
- New and returning visitors
UTM-tagged links can make campaign attribution more reliable.
6. Conversion Rate
Conversions are valuable actions completed after a social interaction. Depending on the business, a conversion may be a sale, lead form, newsletter signup, app installation, booking, or account registration.
A high-reach post can still have weak business value if it produces no meaningful action.
How to Verify Social Media Statistics
Do not rely on a single blog post when evaluating a company’s online influence. Use a repeatable verification process.
Find the Official Profiles
Begin with social accounts linked directly from the organization’s official website. Check whether the branding, domain, contact details, and posting history match.
Avoid assuming that every account containing “Bounce Media Group” belongs to the same organization. Similar business names can represent unrelated agencies, event companies, publishers, or local marketing firms.
Record the Collection Date
Follower counts and public engagement totals change constantly. Write down the exact date on which you collected the information.
Without a date, a social statistic becomes outdated quickly and cannot be compared fairly with future results.
Use Native Analytics Where Possible
Account owners should prioritize first-party analytics from platforms such as Instagram Insights, Facebook Insights, LinkedIn Analytics, YouTube Studio, TikTok Analytics, and X Analytics.
Public visitors can usually see followers, post frequency, views, likes, comments, and some shares. They normally cannot verify private reach, impression, demographic, conversion, or advertising data.
Request Supporting Evidence
For partnership, advertising, or investment decisions, ask for:
- Native analytics screenshots
- Exported reports
- Defined reporting periods
- Engagement formulas
- Traffic data
- UTM campaign records
- Conversion reports
- Paid versus organic breakdowns
Screenshots should show the platform, profile, date range, and metric name.
How to Interpret the Numbers Correctly
Social statistics need context. A larger number is not always a better result.
A small specialist account may generate more qualified leads than a general account with hundreds of thousands of followers. Similarly, a viral post may increase reach without improving website traffic, subscriptions, or sales.
Use these principles when comparing performance:
- Compare the same platform with the same platform.
- Use identical date ranges.
- Separate paid and organic results.
- Compare similar content formats.
- Check median performance, not only the best post.
- Connect social activity with a business outcome.
- Note algorithm changes, campaigns, and seasonal events.
- Avoid judging quality from follower count alone.
The strongest analysis explains not only what changed but also why it changed and what action should follow.
Why Source Transparency Matters for Search in 2026
Google’s May 2026 core update ran from May 21 to June 2, 2026. Google’s broader core-update guidance continues to emphasize assessing content as a whole rather than chasing isolated ranking fixes.
In June 2026, Google also updated its documentation to clarify that an llms.txt file neither improves nor reduces Search visibility. The company also removed guidance about FAQ rich results and added new advice for evaluating third-party SEO tools and recommendations.
Google’s current guidance for AI Overviews and AI Mode recommends useful, original, non-commodity content with a clear point of view. It specifically warns publishers not to recycle what other pages have already said or depend on unsupported AI-search “hacks.”
For this topic, that means a trustworthy page should acknowledge uncertainty rather than turning repeated online claims into invented facts.
What a Reliable Future Report Should Include
A stronger Bounce Media Group social performance report would provide:
- Links to every official social profile
- Exact follower totals by platform
- Beginning and ending measurement dates
- Raw engagement totals
- A clearly defined engagement formula
- Organic and paid traffic breakdowns
- Screenshots or exported analytics
- Data-source and collection notes
- Previous-period comparisons
- Corrections when historical data changes
These details would allow readers to reproduce the analysis and judge whether the conclusions are reasonable.
ALSO READ: Ironmartonline Reviews Is It Worth Trusting?
Conclusion
The safest explanation of bouncemediagroupcom social stat is that it refers to social media performance information connected with BounceMediaGroup.com and its Social Stats content category.
Although several websites describe it as a full analytics platform, clear first-party evidence of a public software product is limited. The official website has also published numerical performance claims, but those figures are not accompanied by enough raw data or methodology for independent verification.
Readers should use the information as a starting point, confirm the official social accounts, check measurement dates, and rely on native analytics before making marketing or advertising decisions.
FAQs
Is BounceMediaGroup.com Social Stat a software platform?
Public evidence does not clearly confirm a standalone software platform. The official website visibly operates a Social Stats article category, while many software-feature claims come from third-party articles that do not link to product documentation.
Are the reported Bounce Media Group numbers accurate?
The official website has reported figures such as an audience near 240,000 and 18% year-over-year growth. However, it does not display the raw analytics or methodology needed to verify those claims independently.
Which social media metric matters most?
There is no single best metric. Use reach for visibility, engagement for audience response, CTR for traffic, and conversions for business results. The right metric depends on the goal of the campaign.
How can I check a company’s social media performance?
Locate its official profiles, record follower totals and post engagement, examine posting consistency, use native analytics when authorized, and connect website traffic through UTM-tagged links.
Can follower count prove that a brand is influential?
No. Follower count does not show whether the audience is active, relevant, authentic, or likely to convert. Engagement quality, referral traffic, audience fit, and conversions provide better context.
How often should social statistics be updated?
Public profile totals may be checked monthly, while active campaigns may need weekly or daily reviews. Always keep the same reporting window when comparing performance.
For more updates visit: Tum Bons